


Mayfair Retirement & Investment Perspectives
Ask most people how their retirement portfolio is invested and you'll hear a ratio: 60/40, 70/30, 80/20. Ask them why that ratio, and the answers get vague — a questionnaire said so, an old rule of thumb about age, a number inherited from a previous advisor. We think the ratio is the wrong place to start. It's the answer to a question most people were never actually asked.
Start with the only number that's really yours
We begin with spending. What does your retirement actually cost each year — and after Social Security, any pension, and the dividends your portfolio produces, how much must come out of the portfolio itself? We focus on the first five years of retirement, because those years carry the most weight: a deep market decline early on, while you're withdrawing, does far more damage than the same decline later. And we stress-test that number. When the dividends you're counting on are a meaningful part of your income, we assume they could be cut — as many were in 2008 and 2009 — and we plan around the lower figure. When they're only a small piece, we leave them as is; the extra precision isn't worth the trouble.
Then look at what bear markets actually do
Once we know your annual draw, we look together at every significant S&P 500 decline since 1950 — not to frighten anyone, but because the facts are surprisingly orderly:
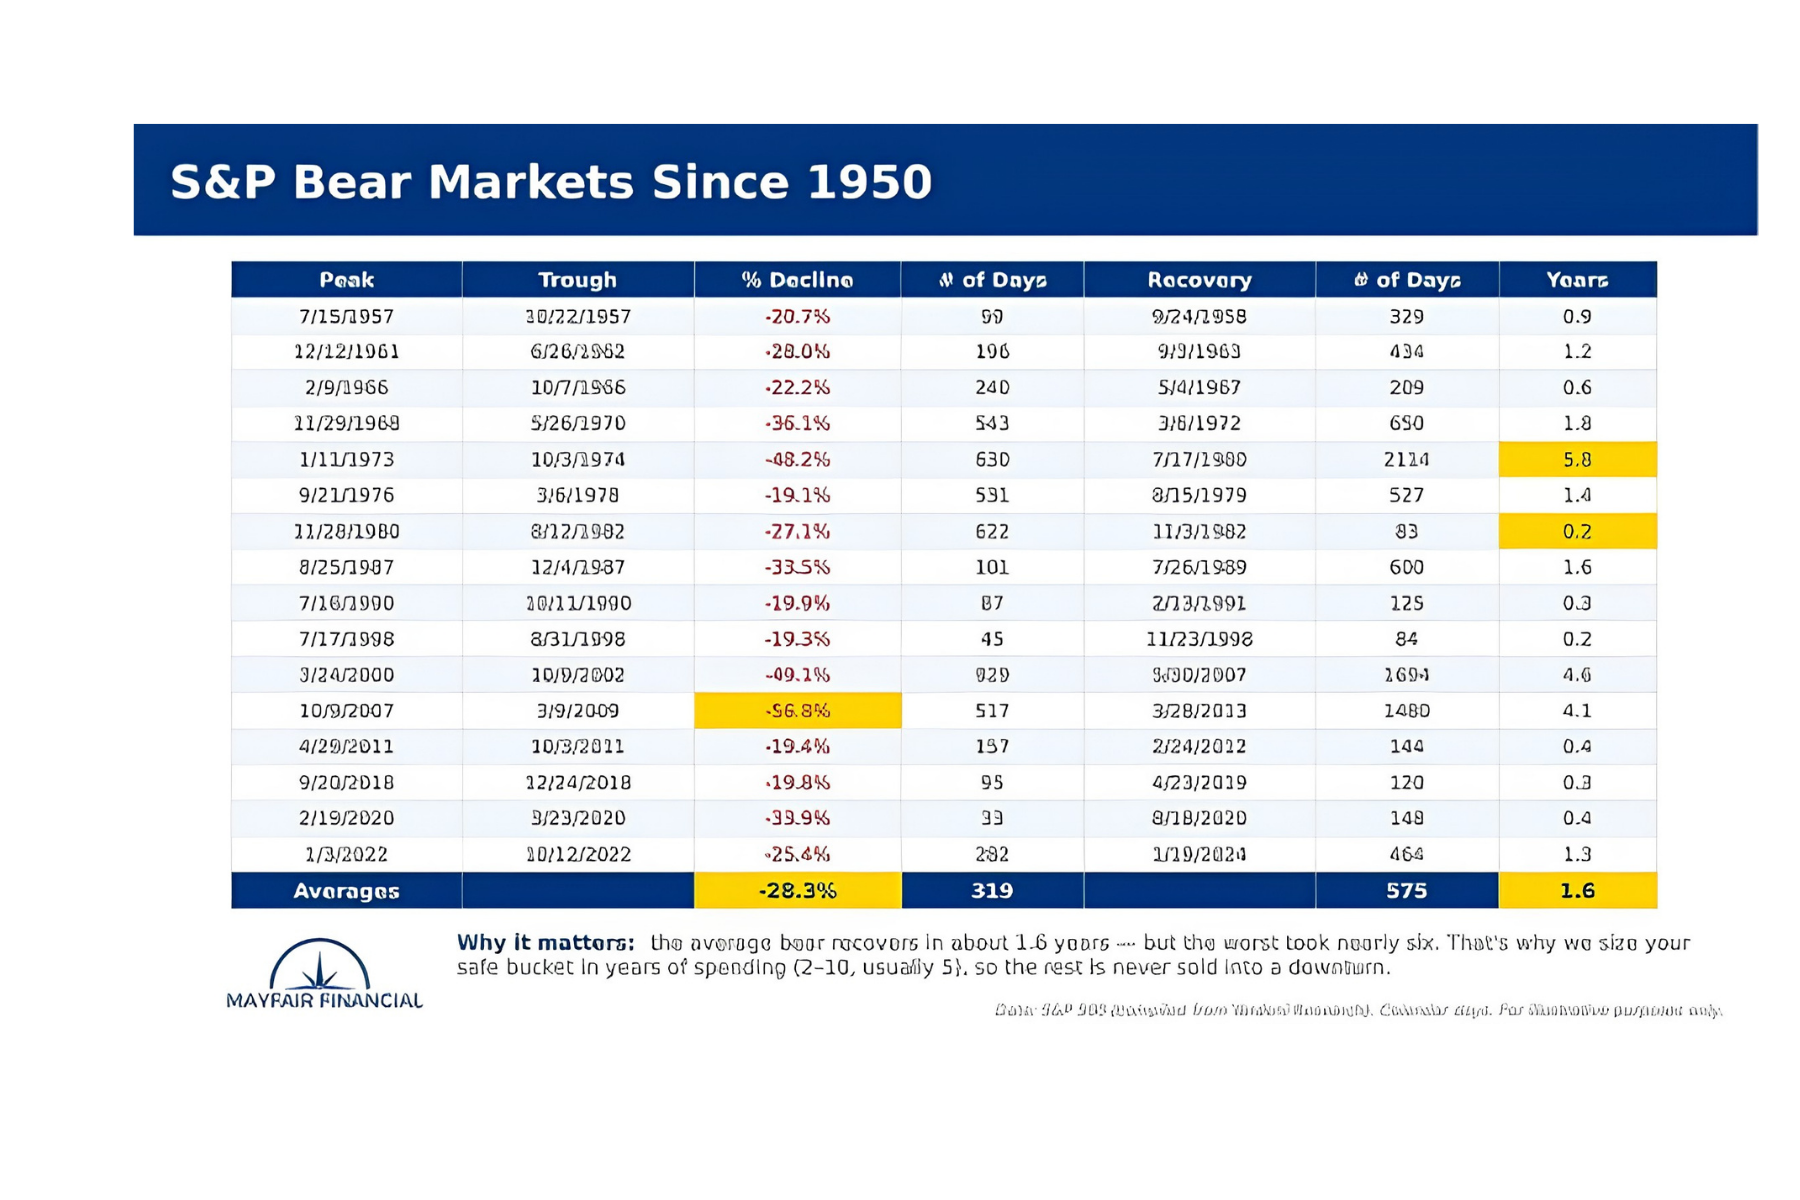
Three patterns matter. Serious declines arrive roughly every five years — they are a feature of investing, not a failure of it. The average decline runs about 28%, and the average round trip from bottom back to the old peak takes about a year and a half. But the worst cases — 1973, 2000, 2008 — took four to six years to fully recover. Any honest plan has to work in those years too.
The question we actually ask you
Here is where our approach parts ways with the questionnaires. We don't ask you to rate your risk tolerance on a scale of one to ten. We ask something you can genuinely answer: how many years of spending would you need to have completely safe — untouchable by any market — to relax and live your best life in retirement?
For our clients, the answer lands somewhere between two and ten years. Two is our minimum — it covers the typical bear market's round trip, and we don't take on clients who want less, because that's a plan built on hope. Most people, after seeing the table above, settle around five — enough to outlast nearly every bear market in the modern record. A few, who sleep better with more, choose eight or ten.
And then the allocation simply falls out
That choice — your years of safety — becomes your safe bucket: your annual draw multiplied by the years you chose, held only in assets that stay liquid and solvent in any market. Treasury funds, cash, and the like
— not municipal bonds (whose trading froze in 2008 and 2020), not preferred stocks, not anything that wobbles precisely when you need it. The safe bucket has exactly one job — to be there when you need it — and that job decides what's allowed in. We'll take that up in its own piece soon; for now, the short version is that only short, high-quality, always-liquid assets qualify. The safe bucket becomes your fixed income.
Everything else goes to work in equities.
A quick example: a couple with a $4 million portfolio needs $160,000 a year from it and chooses five years of safety. Their safe bucket is $800,000 — which is 20% of the portfolio. Their allocation is 80/20. Not because a questionnaire said so, but because $800,000 is what lets them ignore the next bear market entirely. The percentage is a byproduct. The years are the decision.
“Isn't this just mental accounting?”
Fair question — academics have asked it for years. Research on “bucket” strategies points out, correctly, that a total-return portfolio with disciplined rebalancing is mathematically almost identical. Money is fungible; drawing labels on it doesn't change the arithmetic.
We agree with the math — and we use the buckets anyway, deliberately. The buckets aren't a calculation; they're behavioral engineering. The most expensive mistake in retirement investing isn't picking 70/30 instead of 75/25 — it's selling stocks at the bottom of a bear market because the fear became unbearable. In our experience, an investor who can say “my next seven years of groceries are in Treasuries” does not panic in year two of a downturn. The spreadsheet calls that mental accounting. We call it the reason our clients stay invested long enough for the math to work.
The discipline runs both directions, too: when markets recover and reach new highs, we refill whatever safety was spent — so the bucket is rebuilt in good times and drawn down in bad ones, never the reverse.
The result
An allocation you can explain in one sentence: enough safety to live your life through any market we've ever seen, and every remaining dollar compounding for the long term. When your spending changes, the allocation changes with it — for a reason you'll understand, because you chose it.
If you'd like to talk through what your own years-of-safety number might be, we'd be glad to walk through it with you. Think it over, and let us know what questions you have.
Past performance does not guarantee future results. The historical table is for illustration; results will vary. This article is educational and is not individualized investment, tax, or legal advice.